
What an index is
An index is a basket of stocks turned into one number. The Nifty 50 is fifty large companies, weighted by size, added up. When the news says "the market rose one percent", it means that number.
One number for a basket is useful because it answers a question no single stock can. Is this group doing well? Was my idea about this sector right? Did the theme move, or just the one company I happened to buy?
The problem with the official ones
The exchanges publish indexes for the big sectors: banks, IT, pharma, autos. They do not publish one for affordable housing finance, contract manufacturing, cables, hotels or co-working. Those are the themes people actually invest in, and for each of them the only way to know how the group did is to open every company and average in your head.
And when you have your own idea, five stocks you think belong together, there is no index at all. You track them as five separate prices and never see the whole.
Custom Index solves both. Forty-four ready-made theme indexes, each a basket of the listed companies in that theme, charted like any index. And a builder, so any list of stocks becomes an index of its own.
The pre-built indexes
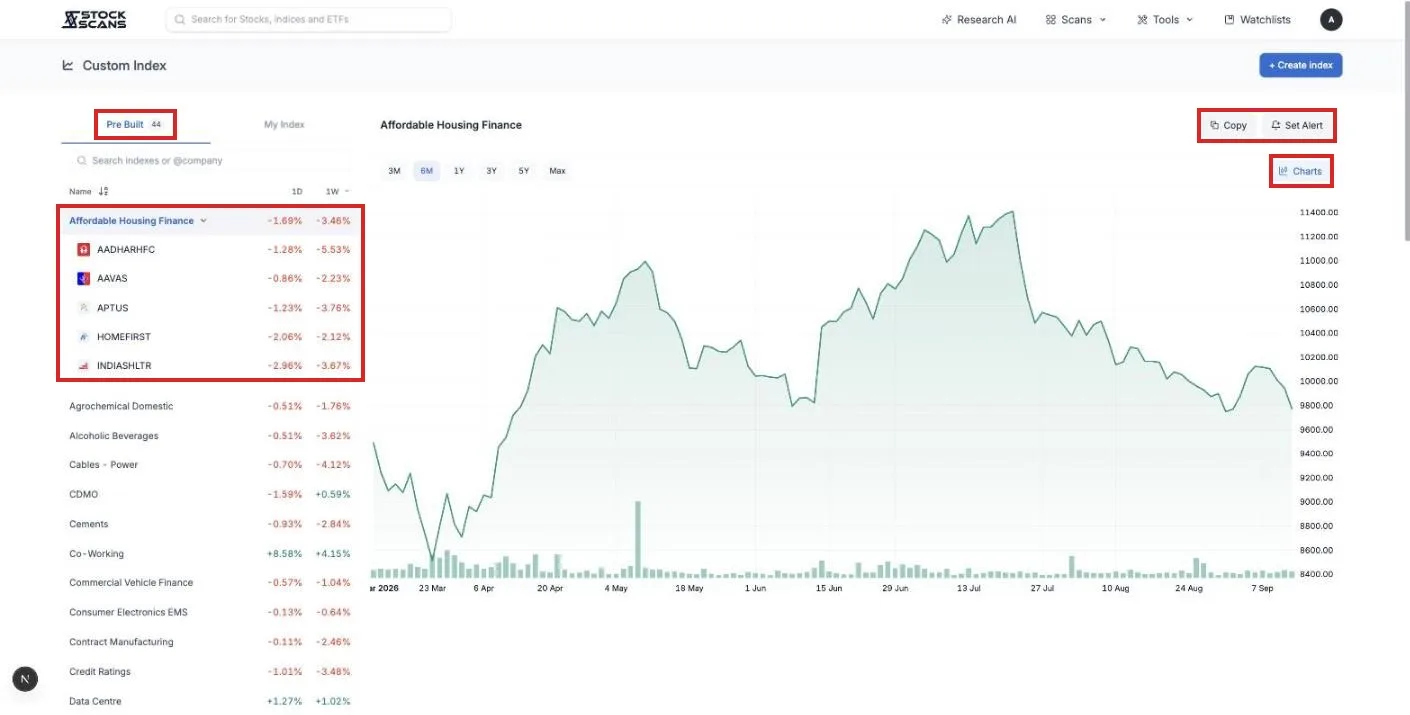
Open Custom Index under Tools in the top menu. The Pre Built tab lists the themes: Affordable Housing Finance, CDMO, Data Centre, Diagnostics, Geospatial, Gold Loan Finance, Hotels, PSU Banks, QSR, and thirty-five more. Each row shows the return over one day and one week.
Click a name and the chart on the right shows the index. Click the small arrow beside the name and the row opens to show the companies inside it, each with its own returns, so you can see which members carried the week and which dragged.
Every index is pinned at 10,000 on a recent starting date and moves from there. Each company gets an equal share, so a small company counts as much as a large one, and the index is rebalanced monthly to keep it that way. That is a deliberate choice. A size-weighted index of a theme is mostly its biggest member. An equal-weighted one is the theme.
The buttons above the chart, 3M to Max, change the range. The Charts button opens the same index in the full charting page, where you can add indicators or compare it against the Nifty.
Finding an index by company
Type a company's symbol with an @ in the search box, @reliance for instance, and the list narrows to the indexes that hold it. It is the quickest way to answer "what theme is this stock part of, and how is the rest of that theme doing".
Choosing what the columns show
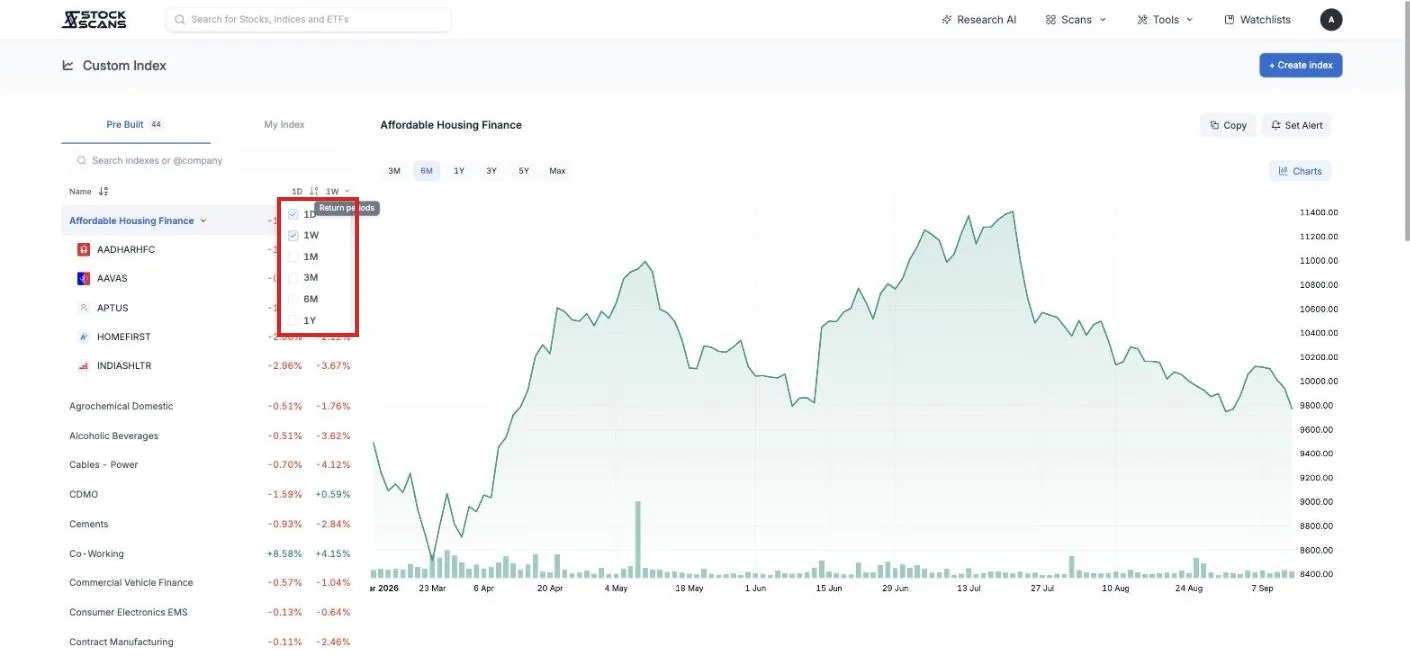
Press the small arrow beside the column headings and pick the return periods you want: one day, one week, one month, three months, six months, one year. Sort by any of them. Sorting the pre-built list by one month is a fast way to see which themes the market has been rotating into.
Building your own
Press Create index. Give it a name and search for stocks, one at a time. Each one you pick is added to the list, with a cross to remove it. Press Create and it appears under My Index, charted like the pre-built ones.
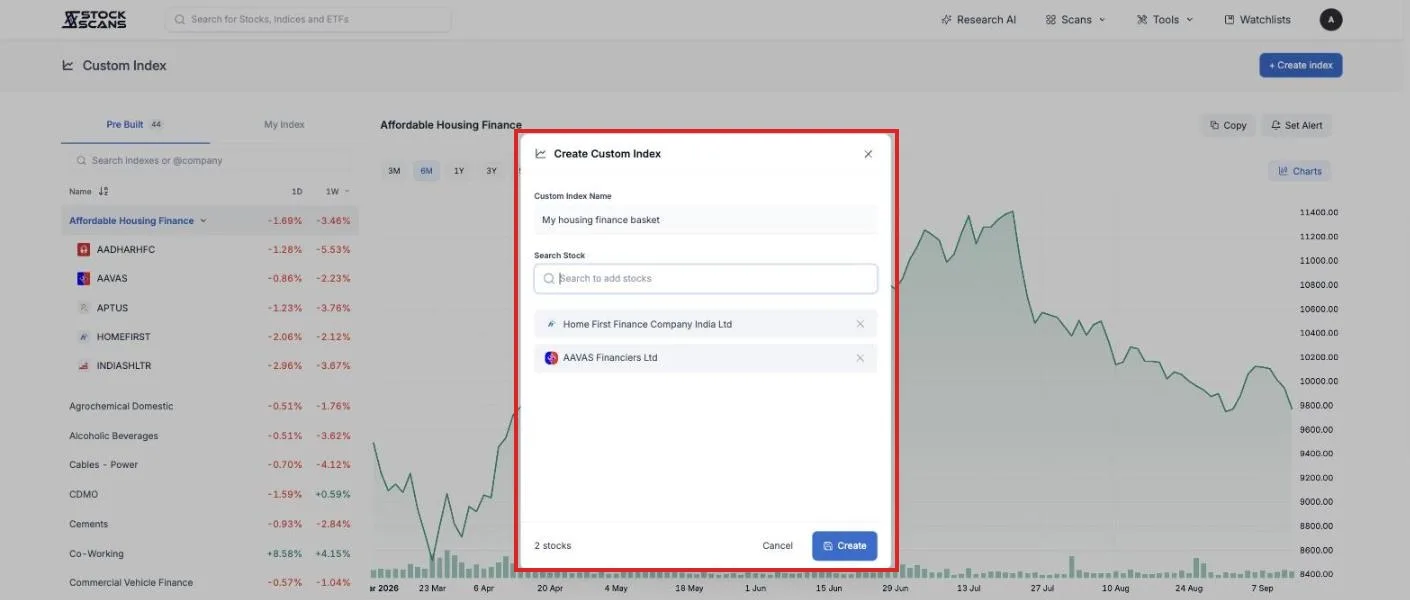
It is the same equal-weighted index as the pre-built ones, so your basket and the theme indexes are directly comparable.
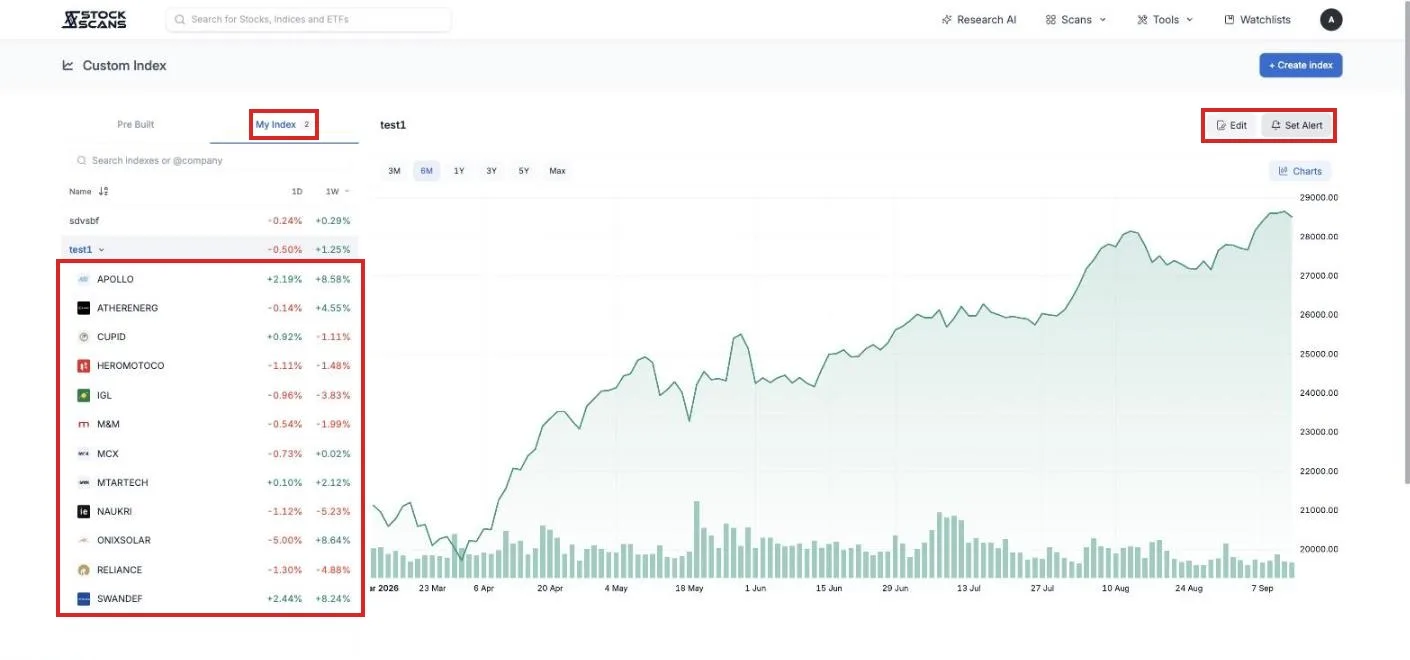
If a pre-built index is close to what you want, press Copy on it. A copy lands in My Index, and Edit lets you add or remove companies. Starting from the Hotels index and adding two companies you think belong is faster than starting blank.
Alerts on a basket
Press Set Alert on any index, pre-built or your own. The alert is a condition on the index itself, not on a member: the index closing above or below its 20, 50, 100 or 200-day average, or its distance from its own 52-week high or low.
An alert like "my defence basket closes below its 50-day average" is a single message that says the theme has turned, without you checking twelve charts. Alerts are checked twice on every market day, late morning and mid-afternoon, and arrive by email or Telegram. Each one fires once, then it is done.
Where else it shows up
Anything that takes an index takes a custom index. Under Research AI, an answer that names a group of companies has a Custom index button that turns them into one. In any watchlist or scan table, select a few rows and choose Add to custom index. In Charts, the Custom Index panel on the right lists yours, and an index chart can carry drawings and drawing alerts like a stock.
What is free
All 44 pre-built indexes, their members, the returns table and the chart. No account needed.
Two indexes of your own, up to twenty stocks each, with a free account.
Premium allows twenty indexes of thirty stocks, and ten index alerts. Premium Plus goes to eighty indexes of forty, and fifty alerts.
Two habits worth forming
Check the theme before the stock. Before buying a company for its sector story, open its theme index with @symbol. If the index is up thirty percent in three months and the company is up eighty, you are buying the company, not the theme. Worth knowing which.
Turn a watchlist into an index. Ten stocks you follow, as one line. A month later the line tells you whether the list is working, which no list of ten prices ever quite does.
Any group of stocks can be an index now. Including yours.
Comments