
What an IPO is
A private company decides to sell shares to the public for the first time. It files a long document with the regulator describing the business, the numbers and the risks. Then, for three days, anyone can apply for shares at a fixed price band. If more people apply than there are shares, a lottery decides who gets them. A week later the stock lists and trades like any other.
That is the whole mechanism. The three questions that matter are: what am I buying, who is selling and why, and how many others want it. The answers to the first two are in the prospectus. The answer to the third is the subscription figure, which changes by the hour while the issue is open.
The problem with deciding
The prospectus runs to several hundred pages. The subscription numbers sit on exchange websites in a format built for compliance, not reading. Dates, price bands and lot sizes are scattered across news sites. And the loudest source of all, grey-market chatter, is not a source.
So most first-time applicants decide on a headline and a subscription number someone posted, and find out what the company does after listing.
IPO Scans collects everything for each issue on one page. What the company does. Five years of financials. Who is selling and where the money goes. The risks the company itself listed. And the subscription, by category, refreshed every few minutes while the issue is open.
The board
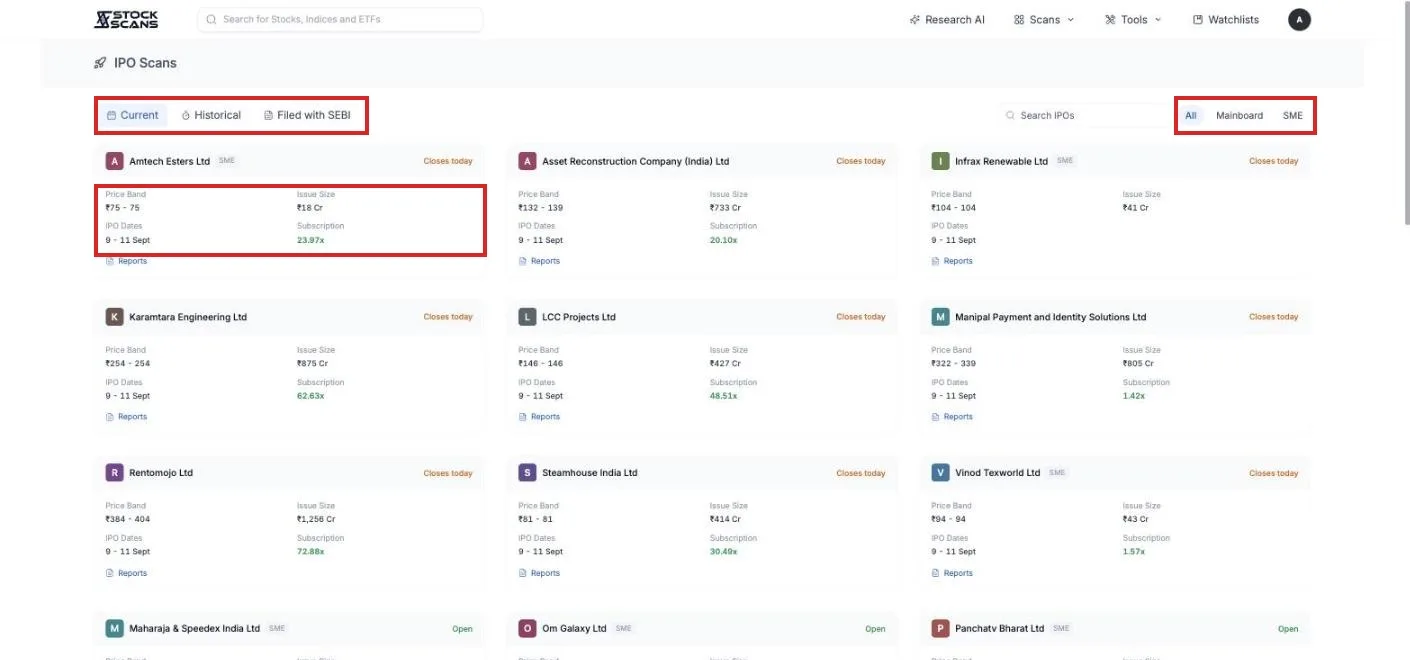
Open IPO Scans from the top menu. The Current tab shows every issue that is open, closing today, upcoming or recently closed. Each card has the price band, the issue size, the dates and the current subscription multiple. A small SME chip marks the smaller exchange issues, and the Mainboard and SME buttons filter to either.
Click a card to open the issue.
One issue, one page
The top of the page is the summary: price band, lot size, the minimum investment for one lot, issue size, and how much of it is fresh money into the company versus existing holders selling out.
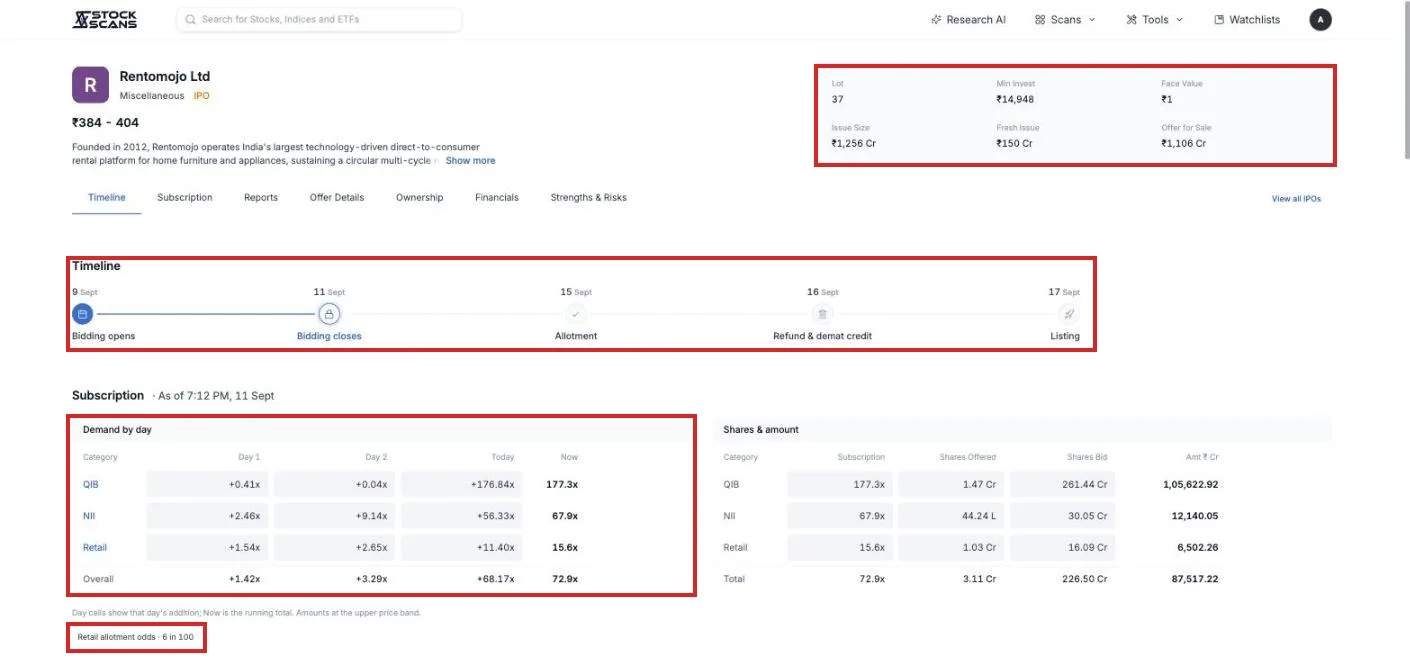
Timeline shows the five dates that matter: bidding opens, bidding closes, allotment, refund, listing.
Subscription is the live part. The left table shows how much each category added each day, QIB, NII and Retail, with a running total. The right table shows the same in shares and rupees. The QIB line is the one to watch, since that is the institutional money. Under the tables is a line that answers the question most people actually have: retail allotment odds, N in 100. At 15 times subscribed, roughly six applicants in a hundred get a lot. Knowing that before applying changes how many applications you bother with.
Scroll down and the page turns into the prospectus, condensed.
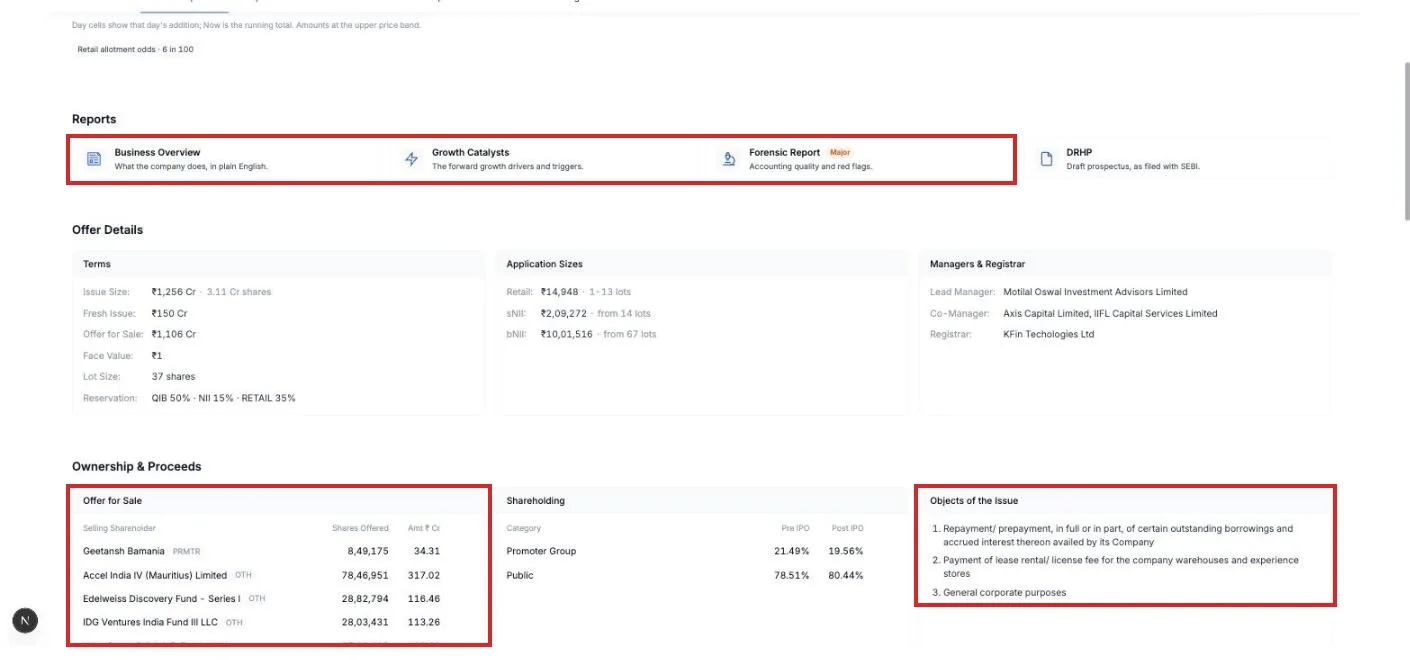
Offer Details has the terms, the application sizes for each category, and the bankers and registrar.
Ownership & Proceeds is the section to read slowly. Offer for Sale lists every existing shareholder who is selling and how much. Shareholding shows the promoter's stake before and after the issue. Objects of the Issue is where the fresh money goes, in the company's words. An issue that is mostly early investors exiting, with the proceeds going to "general corporate purposes", reads very differently from one raising money for a named plant.
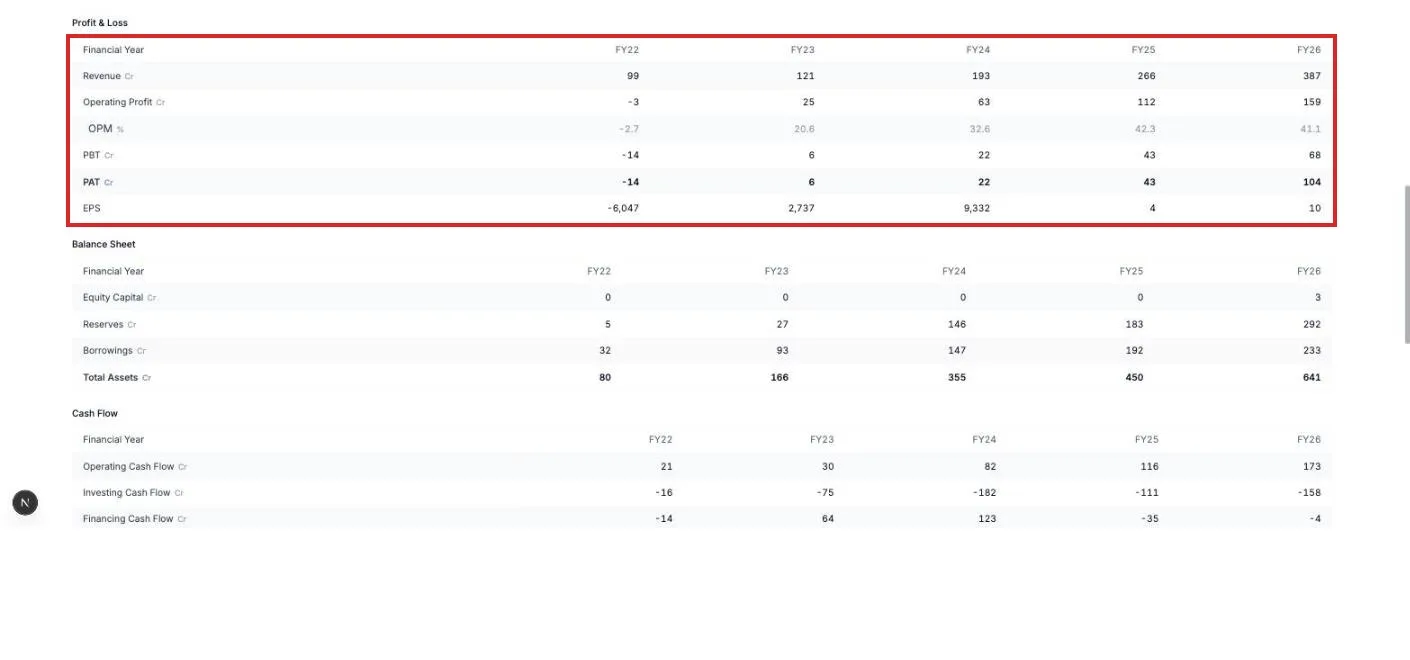
Financials gives five years of profit and loss, balance sheet and cash flow, in the same shape as any listed company's page. Growth and margins over five years, not the one flattering year in the brochure.
Strengths & Risks are the company's own lists from the prospectus, labelled as such. The risks section is long for a reason. Press "Show all" and read the first ten.
The reports
Three reports are written for each issue from the prospectus itself, before listing. Business Overview explains what the company does in plain English, with a fact table of its business mix, market position and customer concentration. Growth Catalysts sets out what would have to go right. Forensic Report checks the accounting for red flags and carries a severity chip: Clean, Minor, Major or Critical.
Next to them sit the DRHP and RHP themselves, so the source is one click away.
After listing
The Historical tab is where IPOs go once they list. For each: the IPO price, the listing-day gain, the price now, and the return since the IPO price. Filter by year, Mainboard or SME.
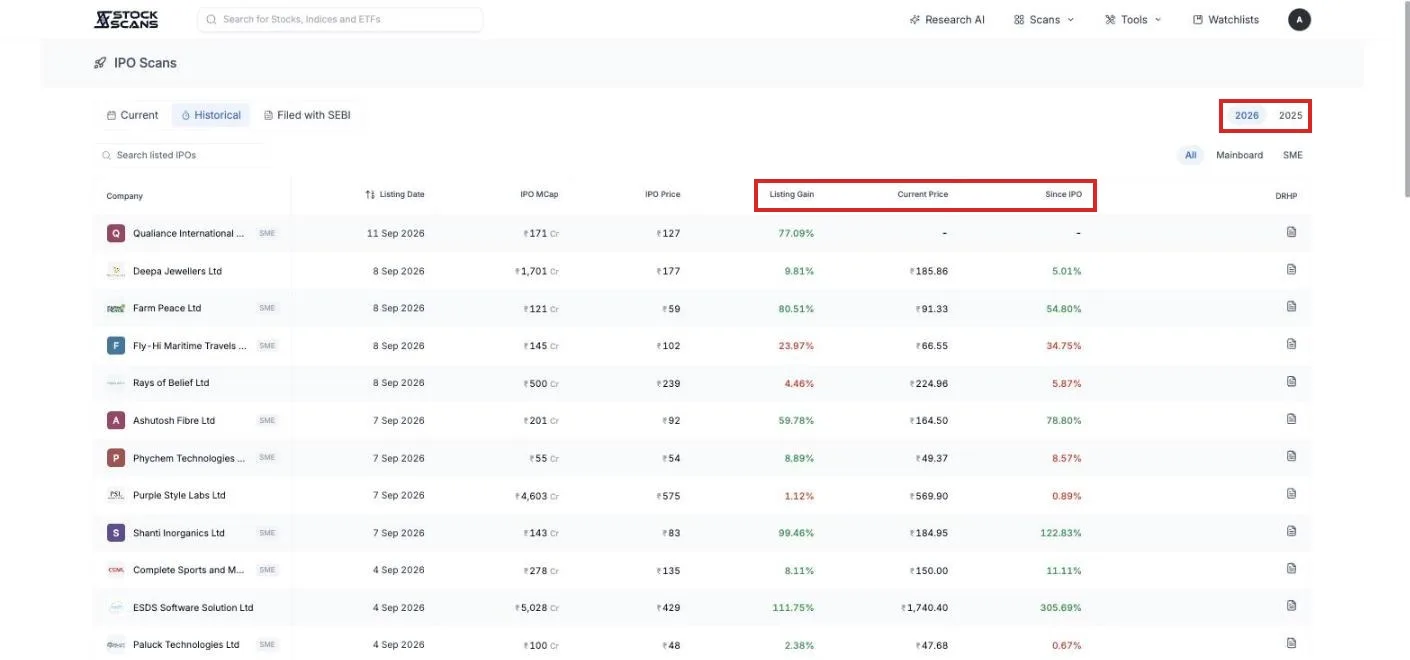
This tab is worth a look before your first application. Listing-day gains and returns a year later are often very different numbers, and seeing a year of them side by side is the fastest education in how IPOs actually behave.
What is coming
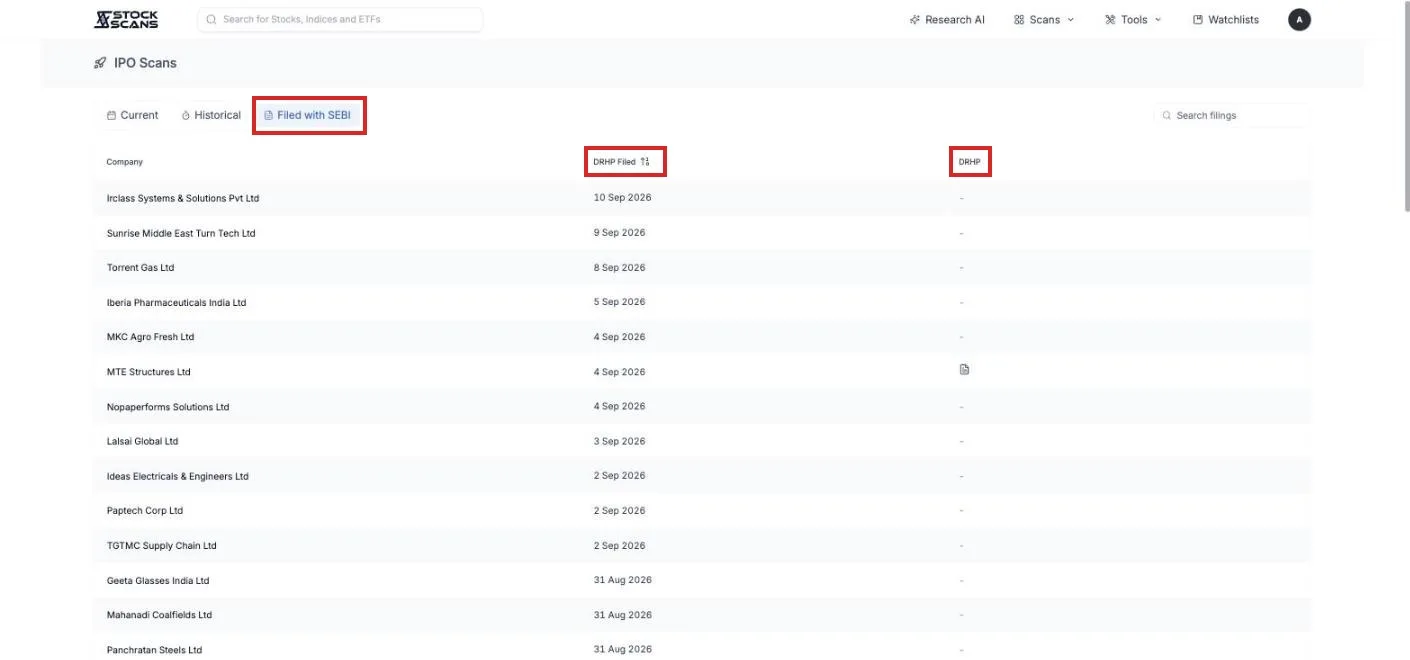
Filed with SEBI lists companies that have filed a draft prospectus but have no dates yet. It is the pipeline, months ahead of the board. When the document is available it is linked from the row.
What is free
Everything on the board, the offering pages, Historical and Filed with SEBI. No account needed, including the prospectus PDFs.
The three reports, with a free account.
There is no paid tier for IPOs. Log in for the reports and the rest is open.
Two habits worth forming
Read the page before the number. Open the issue, read Objects of the Issue and the Offer for Sale table, then the Forensic Report's chip. Only then look at the subscription. Deciding in that order keeps the crowd from deciding for you.
Check the odds before you apply. If retail is 40 times subscribed, that is two or three in a hundred. Apply if you want the shares at that price on listing day too, not just for the lottery.
The prospectus was always public. Now it fits on a page.
Comments