
Before studying individual stocks, there is one question every investor should ask:
What is the market actually doing beneath the headline index?
The Nifty 50 may be rising. Your portfolio may look strong. The news may be optimistic.
But what if only a small portion of stocks are participating in that rise?
Or what if the index is falling while an increasing number of stocks are quietly holding above their key moving averages?
This is where Market Breadth becomes important.
The StockScans Market Dashboard is designed to help you look beyond the headline index and understand the underlying health, participation, momentum and strength of the broader market.
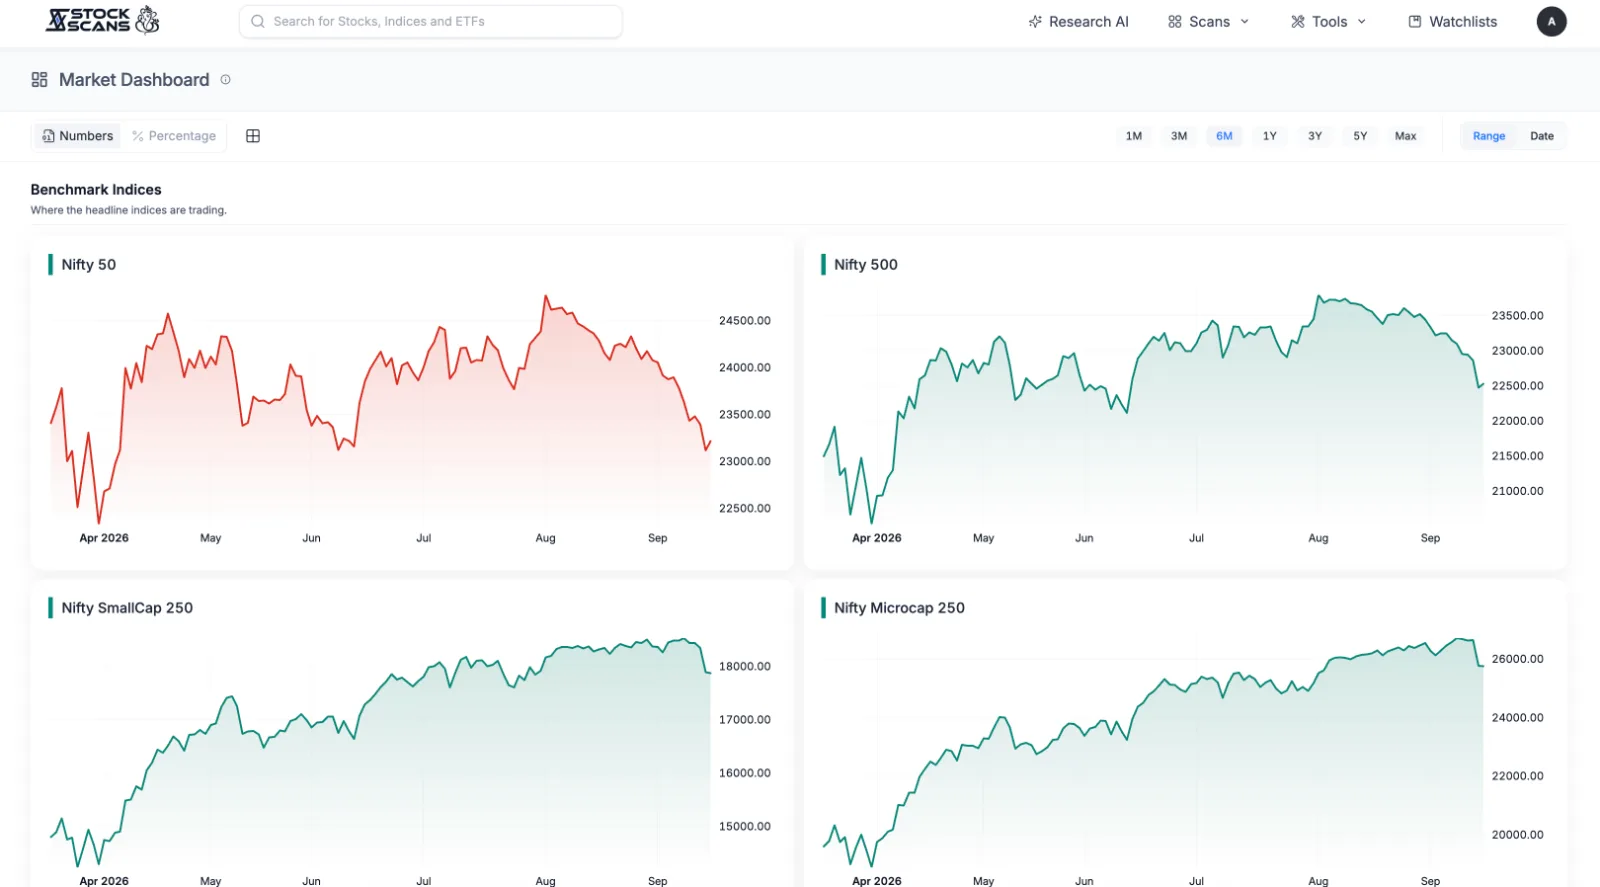
Instead of looking at just one number, the dashboard brings together multiple dimensions of market behaviour:
Benchmark Indices : Where are major market segments trading?
Trend Participation : How many stocks are participating in the trend?
Daily Thrust : Is there unusual short-term buying or selling pressure?
52-Week Extremes : Are more stocks making new highs or new lows?
Together, these indicators help create a broader picture of the market environment.
Why Market Breadth Matters
An index is an aggregation of stocks.
That means an index can move higher even when a relatively smaller group of stocks is responsible for much of the movement.
This creates an important distinction:
Index performance tells you what the market did.
Market breadth helps you understand how broadly that move is being participated in.
For example, imagine the Nifty 500 is falling.
At first glance, this may appear negative.
But suppose:
The percentage of stocks above their 50D EMA is increasing.
The number of new 52-week highs is rising.
More stocks are experiencing sharp one-day inclines.
The index and the underlying participation are telling two different stories.
The purpose of the Market Dashboard is not to declare the market bullish or bearish from one indicator.
Instead, it allows you to observe these different pieces of information together.
What You'll Find on the Market Dashboard
The dashboard is divided into four primary sections.
1. Benchmark Indices
This section tracks:
Nifty 50
Nifty 500
Nifty SmallCap 250
Nifty Microcap 250
These provide a quick view of how different segments of the market are behaving.
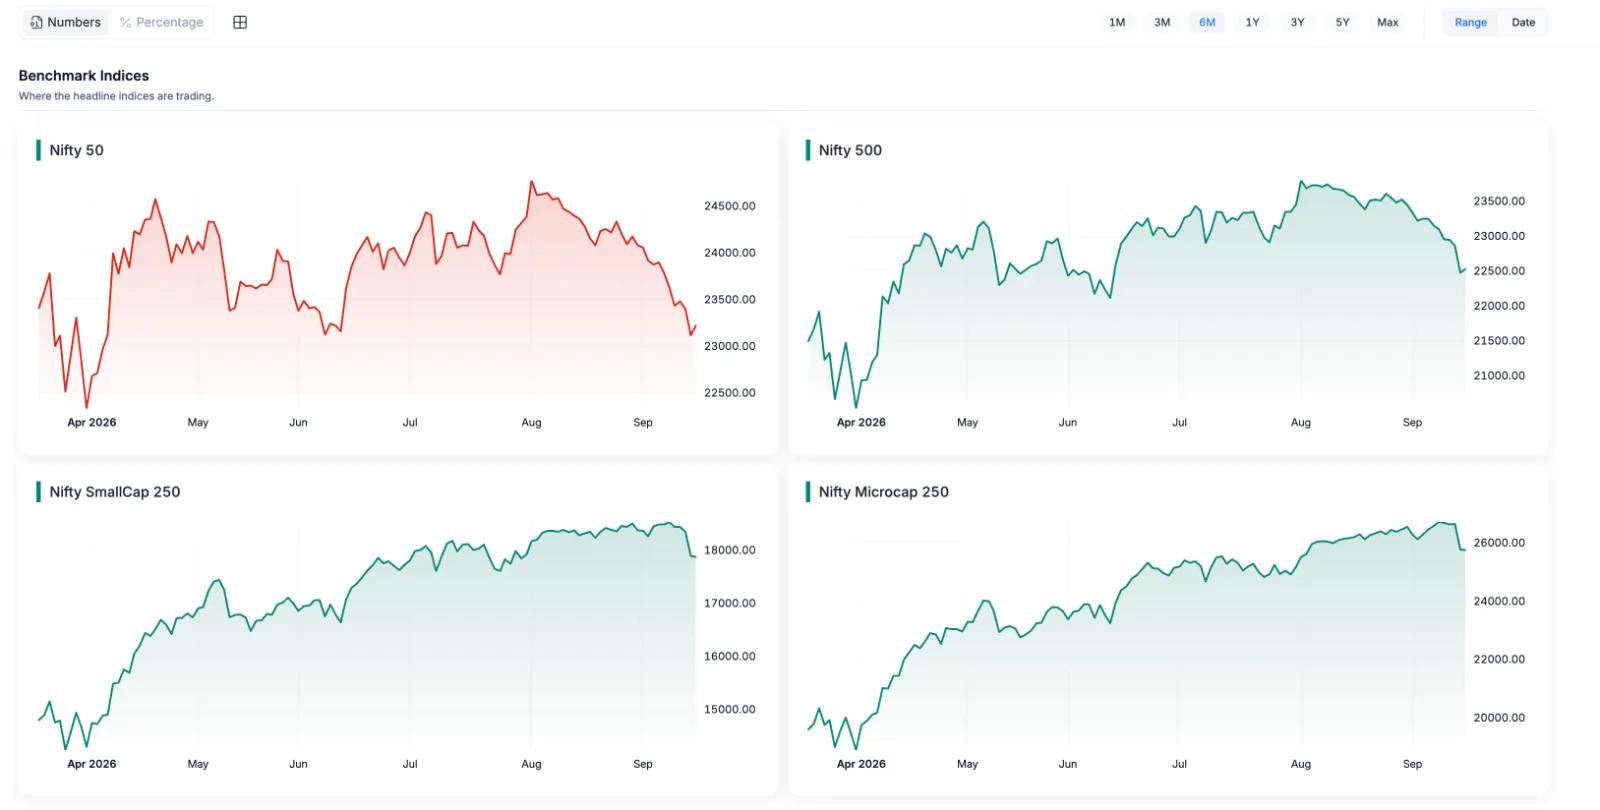
2. Trend Participation
This section looks at the percentage or number of stocks trading above:
20D EMA
50D EMA
100D EMA
200D EMA
This helps answer:
How many stocks are participating in the trend?
The different moving-average periods also allow you to examine participation across different time horizons.
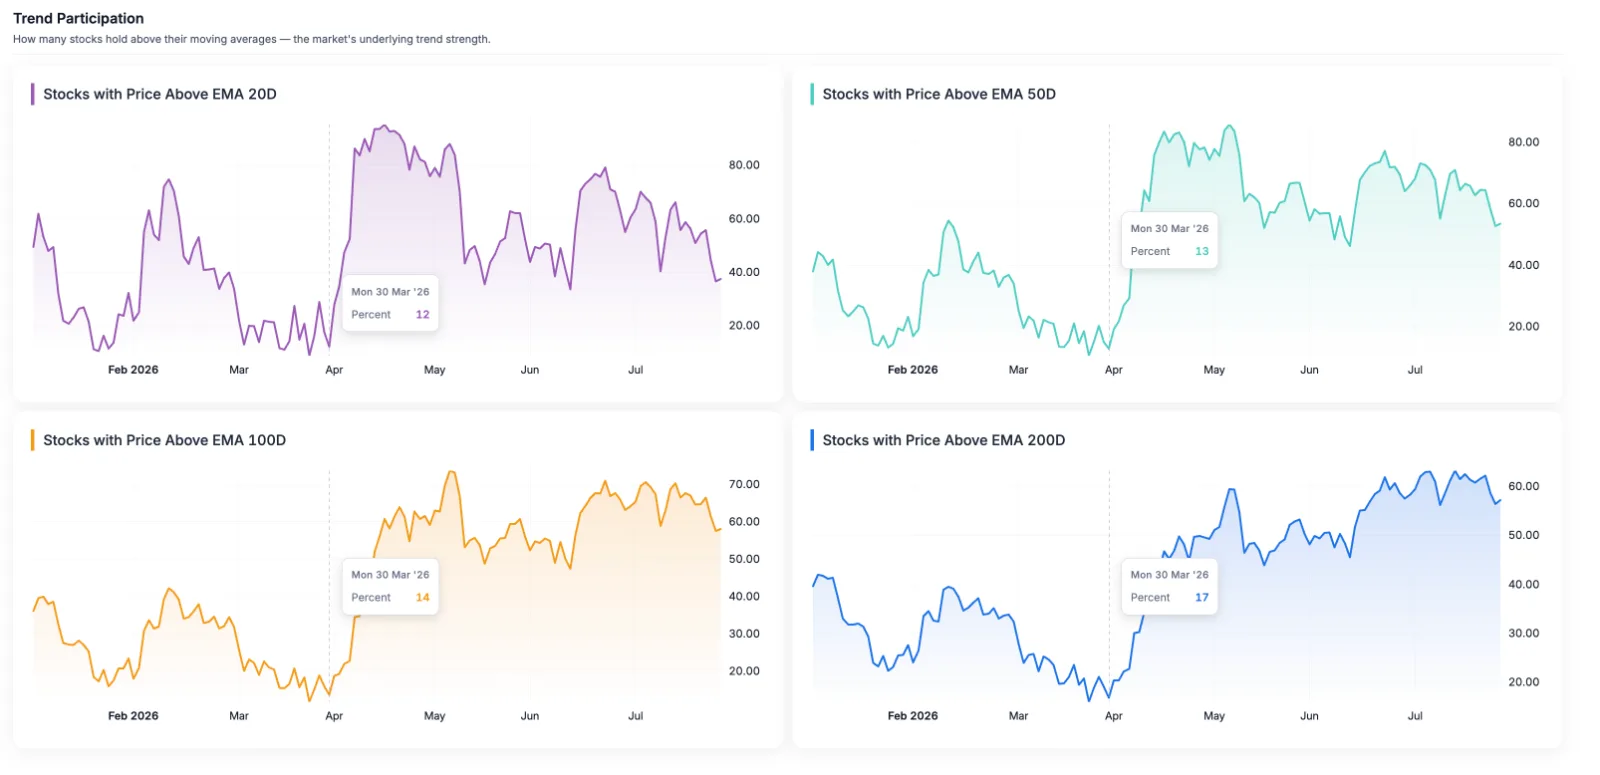
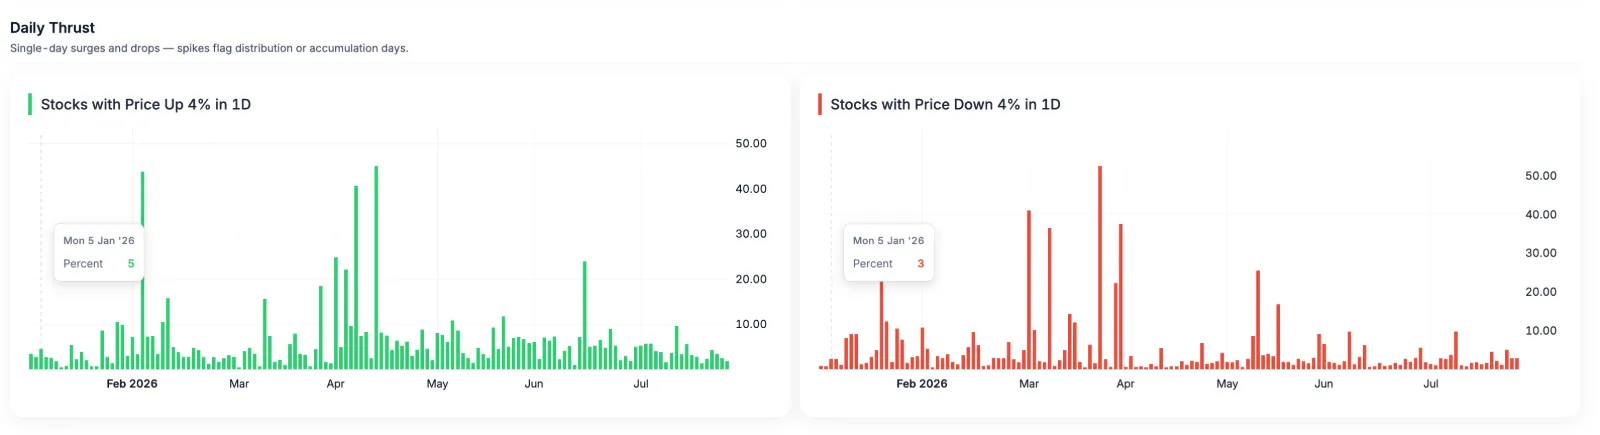
3. Daily Thrust
This section tracks:
Stocks up more than 4% in a day
Stocks down more than 4% in a day
These readings can help identify days when an unusually large number of stocks experience significant price movement.
Rather than focusing on one stock, you are observing whether broad-based buying or selling pressure is appearing across the market.
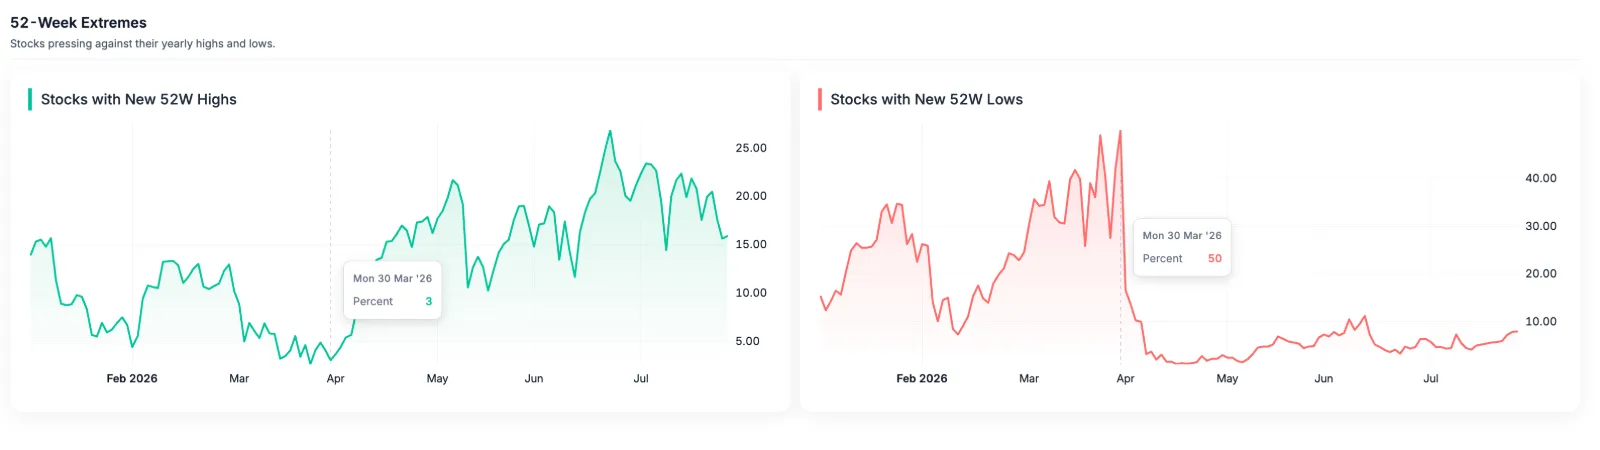
4. 52-Week Extremes
The dashboard tracks:
New 52-week highs
New 52-week lows
This provides another way of understanding market participation.
A market where many stocks are consistently reaching new highs looks very different from one where new lows are expanding.
The Three Questions We Want the Dashboard to Answer:
When using the Market Dashboard, don't think of it as a collection of unrelated charts.
Think of it as answering three broad questions.
Question 1: Where is the market?
Look at the Benchmark Indices.
This gives you the broad context.
Question 2: How broad is the participation?
Look at Trend Participation and 52-Week Extremes.
This helps you understand whether the movement is being shared across a wider group of stocks.
Question 3: What is happening beneath the surface?
Look at Daily Thrust, changes in breadth and the relationship between different indicators.
This is where interesting divergences can emerge.
No single indicator should be treated as a standalone market signal.
For example, a high percentage of stocks above their 20D EMA does not automatically mean the market will continue higher.
Similarly, a rise in new 52-week lows does not automatically tell you that every stock is weak.
The value comes from combining observations.
Think of it like a doctor's health check-up.
One measurement rarely tells the entire story.
You look at several readings together to understand the overall picture.
The same principle applies to market breadth.
A Simple StockScans Checklist
Here's a simple way to use the dashboard before diving into individual stocks:
01 : Start with Benchmark Indices
Understand the broader market direction.
↓
02 : Check Trend Participation
See how many stocks are above their key EMAs.
↓
03 : Check Daily Thrust
Look for unusual broad-based buying or selling activity.
↓
04 : Check 52-Week Highs & Lows
Understand whether stocks are reaching important yearly extremes.
↓
05 : Change the Timeframe
Compare the current reading with its recent and historical context.
↓
06 : Start Your Stock Research
Once you understand the broader environment, move from the market level to sectors and individual businesses.
The Market Dashboard is not designed to replace stock research.
It is designed to improve the context in which you perform that research.
Thanks for reading! 🙌
If you found this feature useful, do drop a comment and let us know.
And if you really loved it, just type “Mazza Aagya!” 😄
Your feedback helps us decide what we should build and explain next.
Comments