
Where the numbers come from
Every three months, every listed company publishes its numbers. Revenue, profit, debt, cash. From those and the share price come the ratios investors talk about: price to earnings, return on capital, debt to equity, dividend yield.
For one company, you can look these up on its page. StockScans keeps more than 300 of them per company, and updates the price-based ones through the trading day.
The trouble starts when you want the same number for every company.
The problem with one page at a time
About 6,000 companies are listed and priced on the NSE and BSE, SME boards included. Say you want the ones that earn a good return on capital, have little debt, and are not expensive. Three numbers. Times 6,000.
Nobody does that. So people fall back on names they already know, or on lists someone else made, or on a tip. The company that quietly meets all three conditions, in an industry you never looked at, stays unseen.
A scan turns this around. You write the conditions once. Every company is checked against them at the same time. What comes back is a list, and only the companies on it deserve your attention.
Your first two minutes
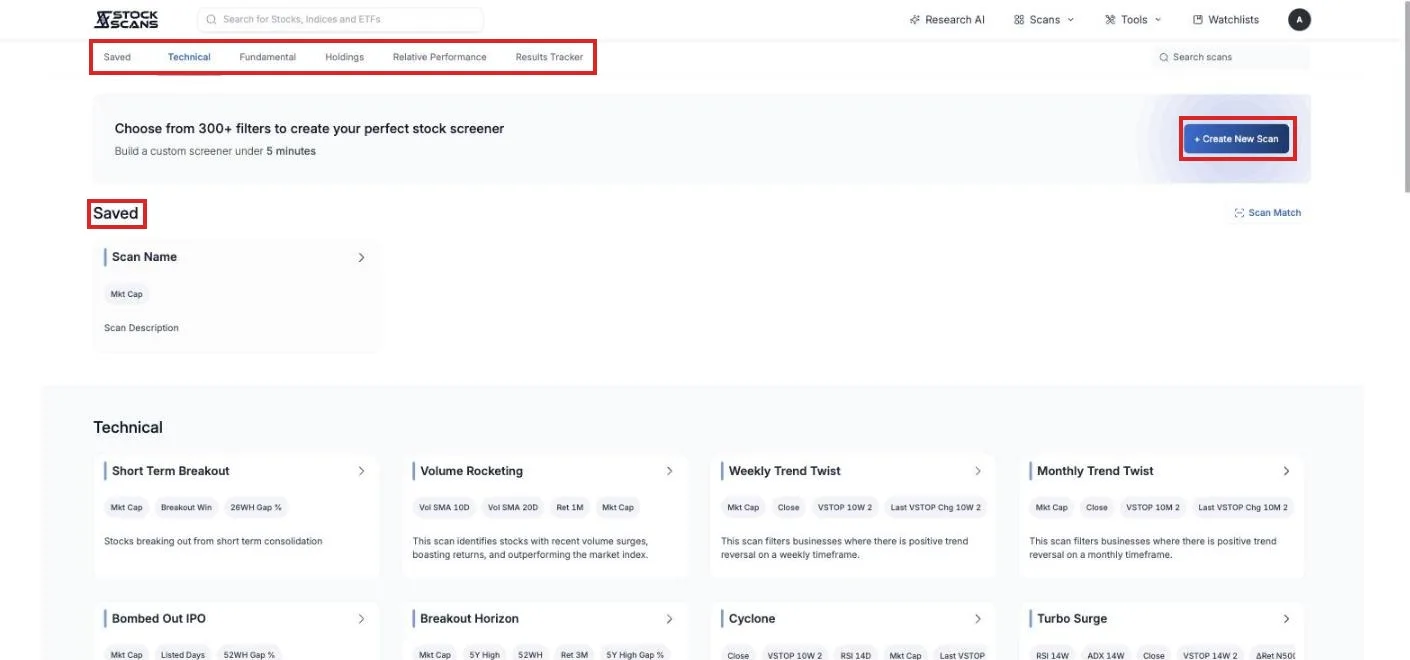
Open Scans in the top menu and choose Stock Scans. Press Create New Scan. You need to be logged in for this one, because a scan runs against live data.
The builder opens with one condition already in place: market capitalisation of at least 1,000 crore. That one row is what takes 6,000 companies down to about 1,600 — it keeps the very smallest out until you ask for them. Delete it and the scan runs over everything listed.
Press Edit to open the conditions. Each row is a sentence: a number on the left, a comparison in the middle, a number on the right. Press Add Filter, type ROCE on the left, and pick a version from the list. Type 15 on the right. Press Run Scan.
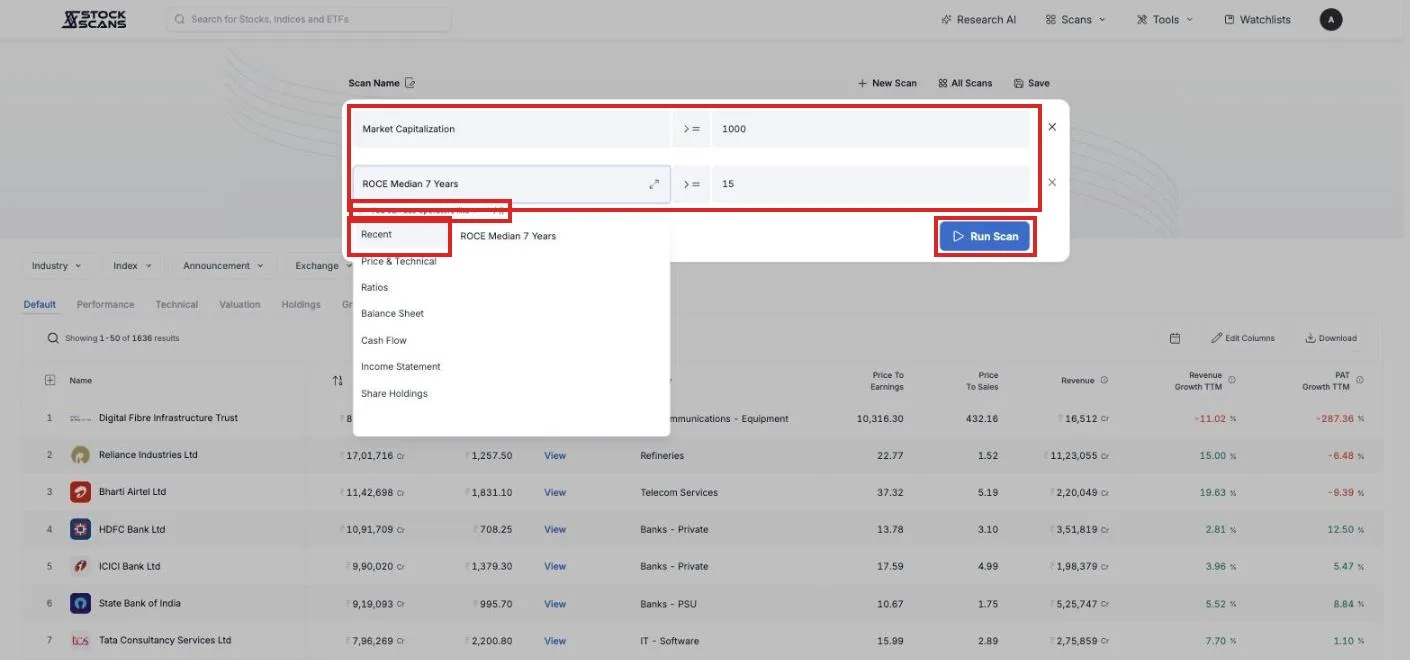
The table below fills with every company that passes both conditions, largest first. You asked two questions of the whole market and got the answer in a second.
Reading the table
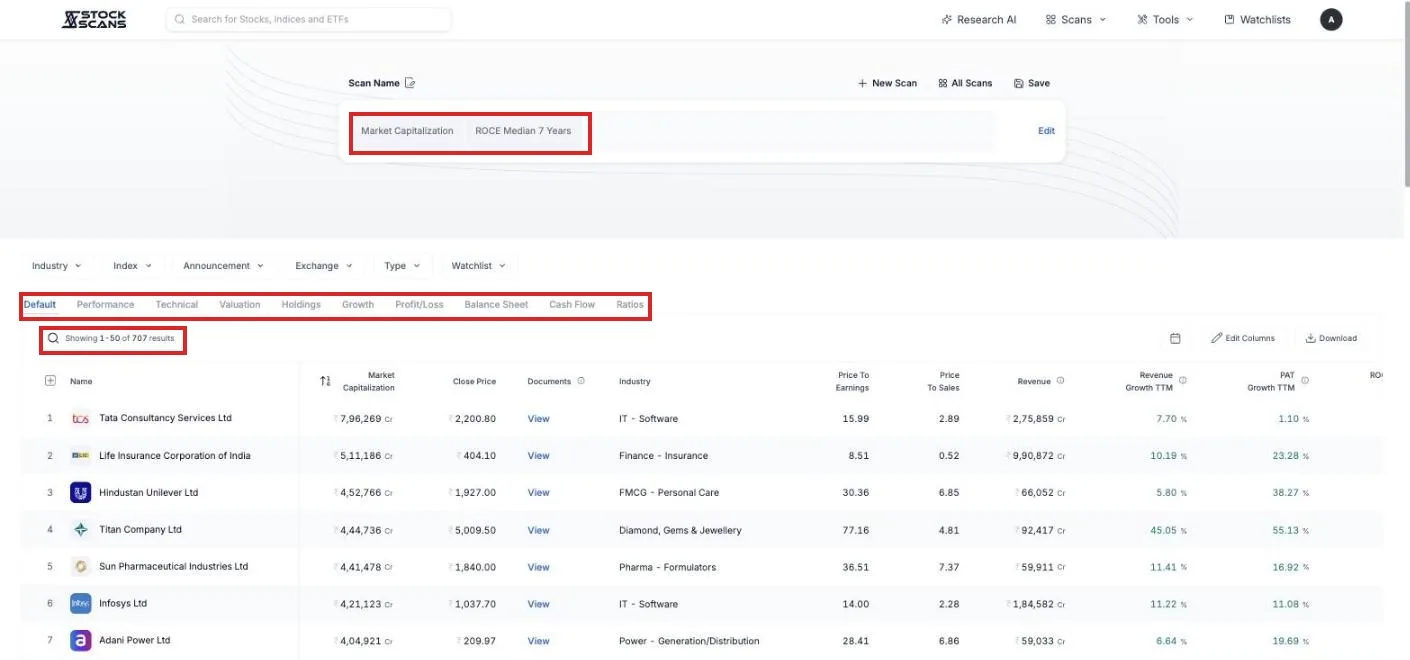
Each row is a company. Each column is a number. The ratios you filtered on are added as columns automatically, so you can always see why a company is on the list.
Click any column header to sort by it. Scroll to the bottom and more rows load. Click a company name and its page opens, or hover to jump straight to its chart.
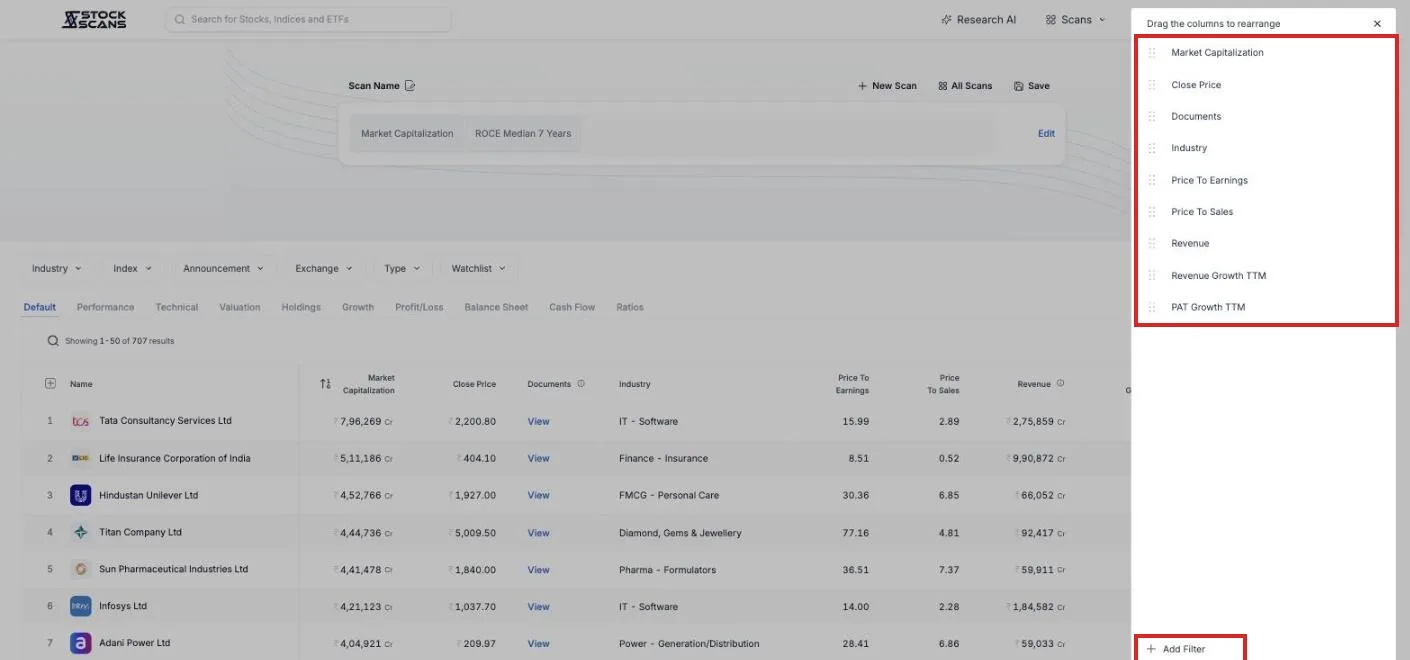
The tabs above the table, Performance, Valuation, Growth, Holdings and the rest, swap in a different set of columns for the same list. Edit Columns lets you build your own set and drag them into the order you want.
The one trick worth learning early
"Is this company cheap?" has no answer on its own. A price to earnings of 30 is expensive for a cement company and cheap for a software company. Cheap compared to what?
The most useful comparison is the company against its own past. Is it trading below what it usually trades at?
StockScans keeps this ready. Alongside each ratio there are its medians over three, five, seven and ten years. So the condition is one line: Price To Earnings Median 5 Years greater than or equal to Price To Earnings. The company's usual PE on the left, today's PE on the right.
Both sides of a condition can be a ratio, not just a number. That is what makes this possible, and it works for any pair: return on capital today against its seven-year median, operating margin against the industry median.
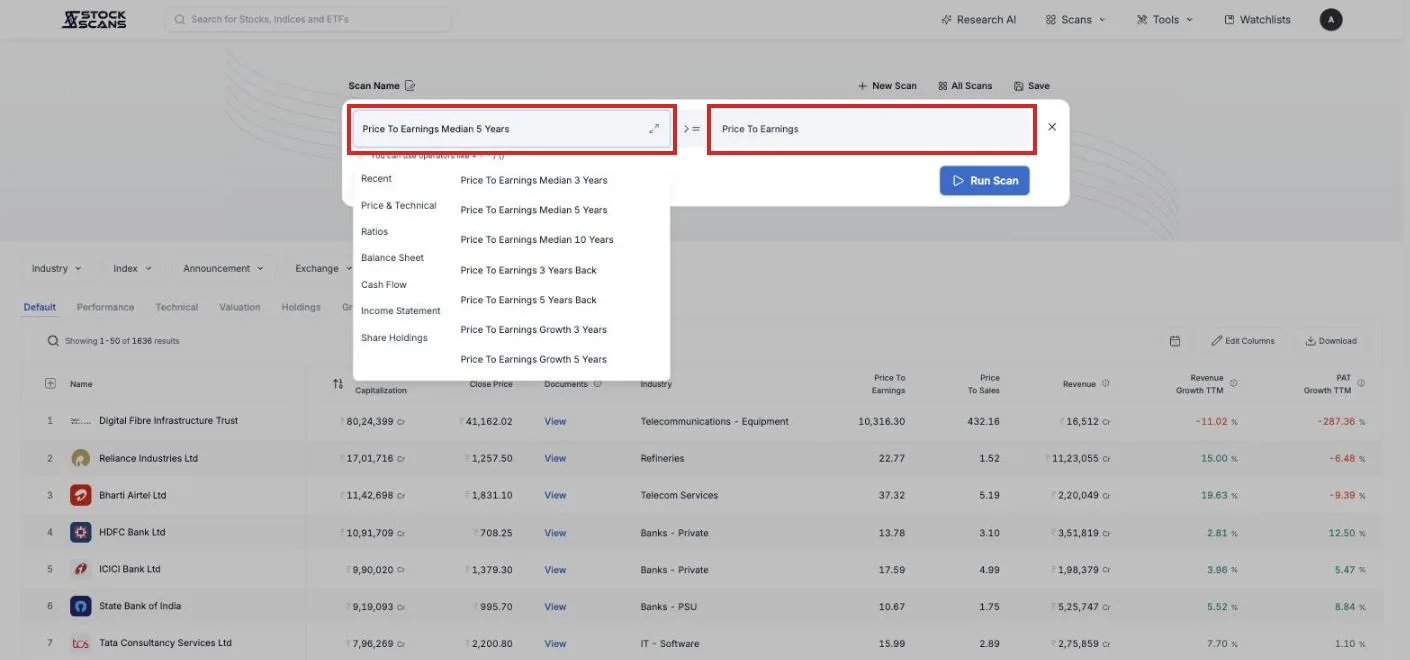
You can also do arithmetic inside a condition. Debt / EBITDA on the left and 3 on the right is a single line. The hint under the box, "You can use operators like + - * / ()", is there for this.
Shrinking the universe
Every condition you add narrows the list. The dropdowns above the table narrow it a different way: by who is in it.
Industry keeps only one or more industries. Index keeps only members of an index, Nifty 500 say. Type keeps large caps, mid caps, small caps or SMEs. Exchange picks NSE or BSE. Watchlist runs the scan only over stocks you already follow. Announcement keeps companies that just released results or shareholding, useful in the weeks after a quarter ends.
Conditions and dropdowns combine with AND. A company must pass all of them — including the default market-cap row. That catches people out on SMEs: there are roughly 1,200 of them, but only about sixty are worth more than 1,000 crore, so setting Type to SME while the default is still in place comes back nearly empty. Delete the row first when you go hunting down there.
Do not start from a blank page
The scans home page has five groups of ready-made scans: Technical, Fundamental, Holdings, Relative Performance, Results Tracker. Each card names the scan, lists the ratios it uses and says what it is looking for.
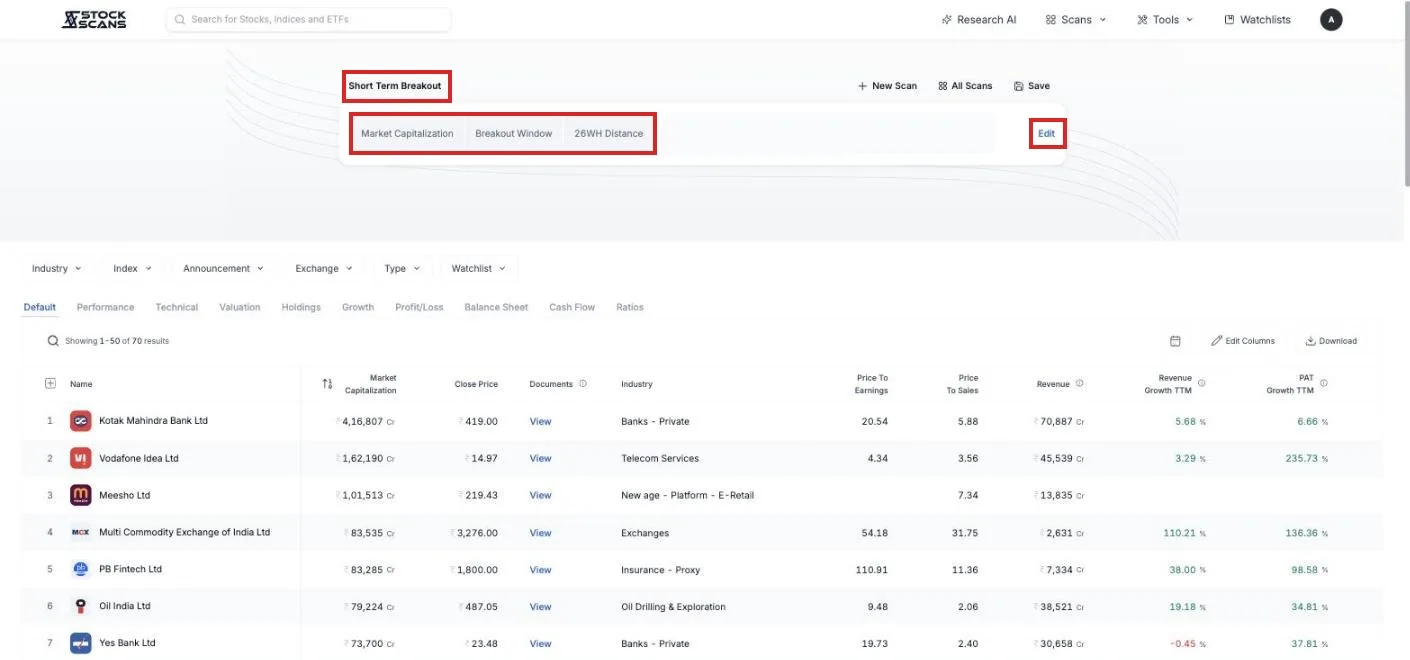
Open one. Its conditions appear as chips exactly like your own. Press Edit to see how it was built, change what you disagree with, run it. If you like the result, save it and it becomes yours.
For a beginner this is the fastest way to learn what a good condition looks like.
Going back in time
A scan normally runs on today's numbers. The calendar icon above the table changes that.
On Date runs the same scan as of a past day. Which companies passed this scan a year ago?
Compare takes two dates and sorts the difference into three lists: Added, companies that pass now but did not then. Retained, companies that passed both times. Removed, companies that dropped out. Point it at last quarter and today, and you see who improved and who slipped.
Save it, share it, get told
Click the scan name at the top to name it and add a line of description. Press Save. It now sits in the Saved section of the scans page, and you can reorder your scans there.
Each saved scan has a share icon. The link opens your scan for someone else as a new, unsaved copy. They see your conditions, not your watchlists.
Then there is Scan Alert. Pick Daily or Weekly. Each morning, or each Saturday, the scan runs on the latest numbers, and if any company entered or left the list you get an email or a Telegram message with the names. A scan you built once keeps watching the market for you.
Which stocks pass the most scans
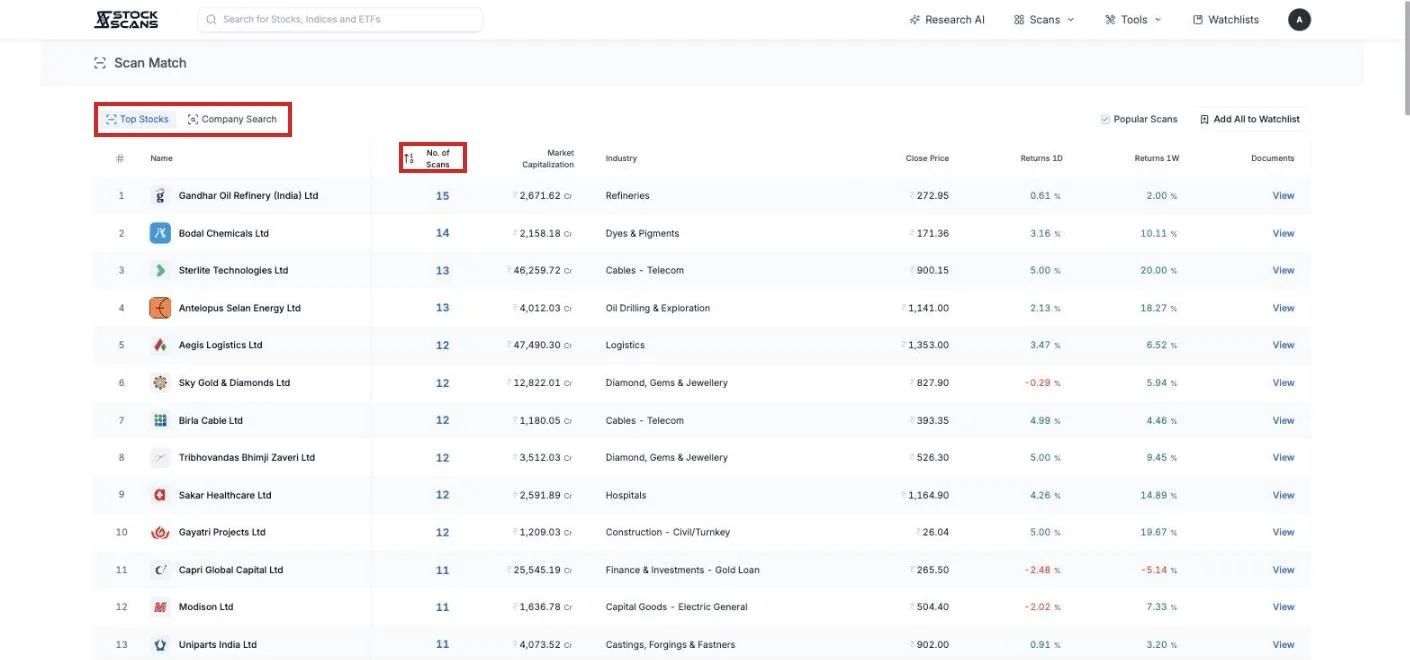
One more page. Scan Match, in the Tools menu.
Its Top Stocks tab runs every one of your saved scans, and optionally the ready-made ones, and ranks companies by how many they pass. A company on twelve different scans at once is telling you something no single scan can. Company Search does the reverse: type a company and see which scans it currently matches.
What is free
Build and run scans. Any conditions, any of the 300+ ratios, results in full.
Ready-made scans. All five groups, open and editable.
Save. Two scans of your own, with up to ten conditions each.
Alerts. Daily or weekly, on your saved scans.
Back in time. On Date and Compare.
Premium is for when you run many scans. More saved scans and more conditions per scan, the Scan Match ranking across all of them, downloading a scan as a spreadsheet, and scans scoped to several industries, indexes or watchlists at once.
Three scans to start with
Quality at a fair price. ROCE Median 5 Years at least 15, Debt To Equity at most 0.5, Price To Earnings Median 5 Years at least Price To Earnings. Save it. Weekly alert.
Growing and getting more profitable. Revenue Growth TTM above 15 and OPM above OPM Median 3 Years. Type set to Mid Cap and Small Cap.
Your watchlist, checked. Watchlist set to your own, one condition: Returns 1M below zero. Which of your stocks fell this month, in one list.
Build one. Run it once a week. The companies will start to sort themselves.
Comments