Home
Alerts
Search
Watchlist
Products
Oceanic Foods Ltd
OCEANIC
BSE
₹ 65.99
3.73%
Last Updated:
29 Apr '26, 4:00 PM
Company Overview
Industry:
Food - Processing - Others
Oceanic Foods Ltd
OCEANIC
BSE
₹ 65.99
3.73%
29 Apr '26, 4:00 PM
Company Overview
Industry
Food - Processing - Others
6M
Price
Charts
Documents
Quick Ratios
Edit Ratios
Mkt Cap
Market Capitalization
₹74Cr
Close
Close Price
₹65.99
Industry
Industry
Food - Processing - Others
PE
Price To Earnings
11.66
PS
Price To Sales
0.43
Revenue
Revenue
₹172Cr
Rev Gr TTM
Revenue Growth TTM
24.01%
PAT Gr TTM
PAT Growth TTM
38.91%
Peer Comparison
How does OCEANIC stack up?
Compare up to 10 companies side by side across valuation, profitability, and growth.
OCEANIC
VS
Quarterly Results
Consolidated
Standalone
Numbers
Percentage
| Quarter | Mar 2023 | Jun 2023 | Sep 2023 | Dec 2023 | Mar 2024 | Jun 2024 | Sep 2024 | Dec 2024 | Mar 2025 | Jun 2025 | Sep 2025 | Dec 2025 |
|---|---|---|---|---|---|---|---|---|---|---|---|---|
| 17 | 20 | 26 | 29 | 36 | 31 | 36 | 36 | 44 | 41 | 45 | 42 | |
Growth YoY Revenue Growth YoY% | -47.7 | -21.3 | 0.2 | 34.0 | 110.0 | 58.2 | 40.9 | 25.4 | 22.9 | 32.6 | 24.4 | 17.4 |
| 16 | 19 | 25 | 27 | 34 | 29 | 34 | 33 | 41 | 38 | 41 | 38 | |
| 1 | 1 | 1 | 1 | 2 | 2 | 3 | 3 | 3 | 3 | 3 | 4 | |
OPM OPM% | 6.0 | 5.2 | 4.1 | 4.5 | 5.6 | 6.9 | 7.0 | 7.4 | 7.1 | 8.4 | 7.7 | 8.7 |
| 0 | 0 | 0 | 0 | 0 | 0 | 0 | 0 | 0 | 0 | 0 | 0 | |
Interest Expense Interest ExpenseCr | 0 | 0 | 0 | 0 | 0 | 0 | 1 | 1 | 1 | 1 | 1 | 1 |
Depreciation DepreciationCr | 0 | 0 | 0 | 0 | 0 | 0 | 0 | 0 | 0 | 0 | 0 | 0 |
PBT PBTCr | 1 | 1 | 1 | 1 | 2 | 1 | 1 | 2 | 2 | 2 | 2 | 2 |
| 0 | 0 | 0 | 1 | 0 | 0 | 0 | 0 | 1 | 1 | 1 | 1 | |
| 0 | 0 | 0 | 0 | 1 | 1 | 1 | 1 | 2 | 2 | 2 | 2 | |
Growth YoY PAT Growth YoY% | 412.5 | -32.3 | -57.9 | -44.7 | 182.9 | 135.7 | 156.3 | 159.6 | 30.2 | 56.6 | 34.1 | 37.7 |
NPM NPM% | 2.4 | 2.1 | 1.9 | 1.6 | 3.2 | 3.2 | 3.4 | 3.4 | 3.4 | 3.8 | 3.7 | 4.0 |
| 0.4 | 0.4 | 0.4 | 0.4 | 1.0 | 0.9 | 1.1 | 1.1 | 1.3 | 1.4 | 1.5 | 1.5 |
Profit & Loss
Consolidated
Standalone
Numbers
Percentage
| Financial Year | Mar 2016 | Mar 2017 | Mar 2018 | Mar 2019 | Mar 2020 | Mar 2021 | Mar 2022 | Mar 2023 | Mar 2024 | Mar 2025 | TTM |
|---|---|---|---|---|---|---|---|---|---|---|---|
Revenue RevenueCr | 63 | 78 | 82 | 78 | 91 | 106 | 124 | 89 | 110 | 147 | 172 |
Growth Revenue Growth% | 25.0 | 4.1 | -3.8 | 16.2 | 16.7 | 16.5 | -28.2 | 23.4 | 34.1 | 17.1 | |
| 57 | 72 | 77 | 73 | 85 | 102 | 118 | 83 | 104 | 137 | 159 | |
| 6 | 7 | 5 | 6 | 6 | 5 | 6 | 6 | 5 | 10 | 14 | |
OPM OPM% | 9.2 | 8.5 | 5.9 | 7.3 | 7.1 | 4.4 | 4.9 | 6.4 | 4.9 | 7.1 | 8.0 |
| 0 | 0 | 0 | 0 | 0 | 1 | 0 | 0 | 0 | 0 | 0 | |
Interest Expense Interest ExpenseCr | 3 | 3 | 2 | 2 | 2 | 1 | 2 | 1 | 0 | 3 | 3 |
Depreciation DepreciationCr | 1 | 1 | 1 | 1 | 1 | 1 | 1 | 1 | 1 | 2 | 2 |
PBT PBTCr | 2 | 3 | 2 | 3 | 4 | 3 | 3 | 4 | 4 | 6 | 9 |
| 1 | 1 | 1 | 1 | 1 | 1 | 1 | 1 | 1 | 1 | 2 | |
PAT PATCr | 2 | 2 | 1 | 2 | 3 | 2 | 3 | 3 | 3 | 5 | 6 |
Growth PAT Growth% | 27.9 | -35.8 | 90.2 | 18.0 | -23.9 | 21.4 | 13.0 | -16.2 | 95.8 | 29.1 | |
NPM NPM% | 2.5 | 2.6 | 1.6 | 3.1 | 3.2 | 2.1 | 2.2 | 3.4 | 2.3 | 3.4 | 3.7 |
| 5.7 | 2.4 | 1.1 | 0.7 | 2.6 | 2.0 | 2.4 | 2.7 | 2.3 | 4.4 | 5.7 |
Balance Sheet
Consolidated
Standalone
Numbers
Percentage
| Financial Year | Mar 2016 | Mar 2017 | Mar 2018 | Mar 2019 | Mar 2020 | Mar 2021 | Mar 2022 | Mar 2023 | Mar 2024 | Mar 2025 | Sep 2025 |
|---|---|---|---|---|---|---|---|---|---|---|---|
Equity Capital Equity CapitalCr | 3 | 4 | 4 | 4 | 11 | 11 | 11 | 11 | 11 | 11 | 11 |
Reserves ReservesCr | 7 | 14 | 15 | 17 | 12 | 14 | 17 | 20 | 23 | 27 | 31 |
| 28 | 25 | 23 | 24 | 20 | 20 | 21 | 9 | 31 | 48 | 47 | |
| 1 | 1 | 2 | 1 | 1 | 3 | 2 | 2 | 2 | 4 | 4 | |
| 39 | 43 | 43 | 46 | 45 | 49 | 52 | 42 | 66 | 91 | 93 | |
| 28 | 31 | 30 | 32 | 30 | 35 | 38 | 28 | 52 | 69 | 70 | |
| 11 | 12 | 13 | 14 | 14 | 14 | 14 | 14 | 15 | 21 | 23 | |
| 39 | 43 | 43 | 46 | 45 | 49 | 52 | 42 | 66 | 91 | 93 |
Cash Flow
Consolidated
Standalone
| Financial Year | Mar 2016 | Mar 2017 | Mar 2018 | Mar 2019 | Mar 2020 | Mar 2021 | Mar 2022 | Mar 2023 | Mar 2024 | Mar 2025 |
|---|---|---|---|---|---|---|---|---|---|---|
| 1 | 7 | 7 | -6 | 9 | 2 | 5 | 16 | -5 | -8 | |
| 1 | -1 | -2 | 7 | -1 | 0 | -1 | -1 | -3 | -8 | |
| 1 | -6 | -1 | 0 | -9 | -1 | -4 | -11 | 15 | 14 | |
Net Cash Flow Net Cash FlowCr | 3 | 0 | 4 | 0 | -1 | 1 | -1 | 4 | 7 | -2 |
Free Cash Flow Free Cash FlowCr | 2 | 4 | 5 | -6 | 9 | 2 | 5 | 16 | -5 | -8 |
CFO To PAT CFO To PAT% | 59.0 | 336.9 | 504.6 | -237.1 | 314.2 | 82.7 | 177.4 | 531.6 | -207.1 | -163.5 |
CFO To EBITDA CFO To EBITDA% | 16.1 | 101.4 | 135.3 | -100.9 | 140.3 | 38.9 | 78.6 | 280.2 | -97.7 | -77.2 |
Ratios
Consolidated
Standalone
| Financial Year | Mar 2016 | Mar 2017 | Mar 2018 | Mar 2019 | Mar 2020 | Mar 2021 | Mar 2022 | Mar 2023 | Mar 2024 | Mar 2025 |
|---|---|---|---|---|---|---|---|---|---|---|
Market Cap Market CapitalizationCr | 0 | 24 | 48 | 46 | 39 | 70 | 70 | 29 | 0 | 50 |
Price To Earnings Price To Earnings | 0.0 | 12.3 | 37.2 | 18.7 | 13.6 | 31.7 | 26.1 | 9.8 | 0.0 | 10.0 |
Price To Sales Price To Sales | 0.0 | 0.3 | 0.6 | 0.6 | 0.4 | 0.7 | 0.6 | 0.3 | 0.0 | 0.3 |
Price To Book Price To Book | 0.0 | 1.4 | 2.6 | 2.2 | 1.7 | 2.7 | 2.5 | 0.9 | 0.0 | 1.3 |
EV To EBITDA EV To EBITDA | 3.8 | 5.7 | 12.3 | 11.3 | 8.1 | 17.9 | 13.6 | 5.1 | 2.0 | 7.9 |
GPM GPM% | 26.5 | 27.0 | 30.1 | 29.8 | 24.3 | 21.6 | 23.9 | 29.4 | 21.4 | 24.0 |
OPM OPM% | 9.2 | 8.5 | 5.9 | 7.3 | 7.1 | 4.4 | 4.9 | 6.4 | 4.9 | 7.1 |
NPM NPM% | 2.5 | 2.6 | 1.6 | 3.1 | 3.2 | 2.1 | 2.2 | 3.4 | 2.3 | 3.4 |
ROCE ROCE% | 15.5 | 18.4 | 11.4 | 12.1 | 15.8 | 10.9 | 13.1 | 14.7 | 8.5 | 12.6 |
ROE ROE% | 16.7 | 11.6 | 7.0 | 11.9 | 12.4 | 8.6 | 9.4 | 9.6 | 7.5 | 12.8 |
ROA ROA% | 4.1 | 4.6 | 3.0 | 5.3 | 6.5 | 4.5 | 5.2 | 7.2 | 3.8 | 5.5 |
### **Corporate Overview: A Pioneer in Dehydrated Food Technology**
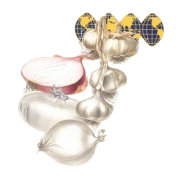
Established in **1972**, Oceanic Foods Limited is a premier Indian manufacturer and exporter specializing in the industrial production of **dehydrated vegetables and herbs**. Operating as a single-segment entity, the company has built a reputation as a critical supply chain partner for leading **Multinational Corporations (MNCs)** in the global food sector.
The company is currently undergoing a strategic transformation, transitioning from a niche dehydration specialist into a diversified food ingredients and commodities player. This evolution is supported by a robust promoter holding of **74.07%** (**8,332,600 shares**) as of **March 31, 2025**, signaling strong management confidence in the long-term trajectory.
---
### **Manufacturing Infrastructure & Quality Framework**
Oceanic Foods operates two specialized units in Gujarat, strategically separated to optimize the dehydration lifecycle:
| Unit | Location | Size | Core Operations |
|:---|:---|:---|:---|
| **Unit I** | Lalpur, Jamnagar | **5 Acres** | Automated primary processing: peeling, washing, slicing, and **steam drying** under a controlled **ozone environment**. |
| **Unit II** | Jamnagar | **0.5 Acres** | Secondary processing: oven-drying, sorting, mincing, grinding, **metal detection**, pulverizing, and toasting. |
**Quality Assurance & Global Compliance:**
To maintain its competitive edge in international markets, the company adheres to rigorous global safety standards, holding certifications including:
* **fssai**, **BRCS** (Food Safety Certificated), **Star-K Kosher**, **HALAL**, and **FDA**.
* Operational frameworks compliant with **ISO 9000**, **ISO 22000**, **HACCP**, **GMP**, and **GHP**.
---
### **Strategic Diversification & Vertical Integration**
In **April 2025**, the company amended its **Memorandum of Association (MOA)** to significantly broaden its commercial scope. This "New Business Model" focuses on high-volume commodities and integrated logistics:
* **Salt Vertical:** Trading and exporting all grades of salt (**edible, industrial, and rock salt**), designed to complement the existing spices business.
* **Energy Trading:** Entry into the **Coal Industry**, involving the distribution of **bituminous, anthracite, and coking coal** to leverage existing merchant capabilities.
* **Oceanic Food Ingredients Ltd:** A **wholly-owned subsidiary** incorporated in **September 2025** to streamline the specialized food ingredients portfolio.
* **Expanded Product Scope:** Authorization to manufacture and trade in **Pulses, Spices, Fruits, Agricultural Produces, Herbs, and Edible Oil**.
---
### **Infrastructure Expansion & Cold Chain Logistics**
To mitigate raw material spoilage and ensure year-round supply consistency, the company is executing a major infrastructure play:
* **Cold Storage Acquisition:** A slump sale agreement with **Julyys Foods** for a facility in **Soyal** (admeasuring **1,891.22 Sq. Mtr**).
* **Capacity:** **2,500 to 5,000 tons** (optimized for Onion Flakes, Granules, and Powder).
* **Valuation:** **INR 12 Crores**, with an initial **INR 3 Crore** advance already approved.
* **Target Completion:** Full integration targeted for **FY 2031-32**.
* **Logistics Autonomy:** Purchase of a **Commercial Truck** in **March 2024** to reduce reliance on third-party internal distribution.
---
### **Financial Performance & Capital Discipline**
While the company has demonstrated revenue resilience, it is currently navigating a high-cost environment.
**Key Financial Metrics:**
| Metric (Rs. in Crore) | FY 2023-24 | FY 2022-23 | FY 2021-22 |
| :--- | :--- | :--- | :--- |
| **Net Revenue (incl. Other Income)** | **109.73** | **89.05** | **124.07** |
| **Net Profit After Tax (PAT)** | **2.47** | **3.01** | **2.69** |
| **Paid-up Equity Capital** | **11.25** | **11.25** | **11.25** |
**Liquidity and Debt Profile:**
* **Foreign Exchange:** Strong export focus with **FY 2022-23 earnings** of **Rs. 49.22 Crores** against an outgo of only **Rs. 58.46 Lakhs**.
* **Working Capital:** Secured by a **first charge** on all current and fixed assets. Facilities include **Cash Credit (Rs. 13 Crore limit)** and **Packing Credit**.
* **Interest Rates:** Borrowings have transitioned to a **3-month T-bill plus 3.01%** (approx. **9.95% p.a.**), reflecting a tighter interest rate environment compared to the previous **7.5% p.a.**
* **Dividend Policy:** The Board opted to **forgo dividends** for FY 2023-24 to conserve capital for the Soyal acquisition and diversification projects.
---
### **Governance, Leadership & Material Transactions**
The company recently emerged from a period of management transition and regulatory settlements, resulting in a more consolidated leadership structure.
* **Leadership:** **Mr. Ajesh Vinodrai Patel** serves as **Chairman & Managing Director** (tenure until **Dec 2026**), with **Forum Ajesh Patel** as **CEO**. Remuneration for both is capped at **Rs. 10 Lakhs per month**.
* **Related Party Framework (FY 2023-24 to FY 2028-29):**
* **VDP Foods & A&T Infra:** Trade limits of **INR 50 Crores** each for dehydrated food items.
* **Julyys Foods:** **INR 12 Crore** slump sale for the cold storage unit.
* **Regulatory Resolution:** Settled a long-standing promoter dispute (withdrawn **May 2024**) and paid **Rs. 12.22 Lakhs** to **SEBI** to resolve historical non-disclosure issues. A **Rs. 94.71 Lakh** BSE penalty provision was reversed following full compliance.
---
### **Risk Management & Mitigation Strategy**
Oceanic Foods employs a structured framework to categorize and address operational and macroeconomic risks:
| Risk Category | Primary Drivers | Mitigation Strategy |
|:---|:---|:---|
| **Market & Forex** | Volatile exchange rates and commodity prices (Onion, Wheat, Crude). | Use of **financial derivatives** for hedging; strictly no speculative trading. |
| **Credit Risk** | Counterparty default on trade receivables. | **Credit rating scorecards** and centralized monitoring of receivables. |
| **Liquidity Risk** | CAPEX for Soyal facility and working capital needs. | Matching maturity profiles of assets/liabilities; monitoring **Gearing Ratio**. |
| **Regulatory** | **Code on Social Security, 2020**; SEBI (LODR) compliance. | Quarterly Board reviews and dedicated secretarial audit functions. |
**Operational Challenges:**
* **Reporting Discrepancies:** Management is addressing historical audit notes regarding differences in stock values between bank filings and internal books (e.g., a **Rs. 1,045.23 Lakh** variance in a prior Q1).
* **Unsecured Loans:** The company maintains loans from promoters at **12% p.a.**, which are repayable on demand.
* **Macro Factors:** The **Russia-Ukraine war** and global inflationary pressures continue to impact the cost of raw materials and international freight.